€28,161.28
11.24%/year
(€2,116.28)
- Price return
-
12.85%/year€2,421.39
- Income return
-
1.03%/year€191.95
- Cost ratio
-
-2.66%/year-€497.07
No benchmark
Holdings
|
Security
|
Position
Holding period
|
Net cash invested
per share
|
Value
per share
|
Price return
in %
|
Income return
in %
|
Costs amount
in %
|
Net profit/loss
in %
|
Allocation %
|
|
|---|---|---|---|---|---|---|---|---|---|
|
12
406 days
|
€4,507.38
€375.62/share
|
€3,970.35
€330.86/share
|
-€537.03
-20.94%/year
|
€23.39
0.82%/year
|
-€23.90
-0.8%/year
|
-€537.54
-20.91%/year
|
14.7% | ||
|
11
406 days
|
€1,972.03
€179.28/share
|
€2,344.37
€213.12/share
|
€372.35
26.41%/year
|
- |
-€9.47
-0.78%/year
|
€362.87
25.64%/year
|
8.68% | ||
|
7
406 days
|
€1,002.16
€143.17/share
|
€2,243.15
€320.45/share
|
€1,240.99
106.34%/year
|
€6.37
0.78%/year
|
-€3.73
-0.65%/year
|
€1,243.62
106.47%/year
|
8.3% | ||
|
12
406 days
|
€1,493.45
€124.45/share
|
€2,204.83
€183.74/share
|
€711.38
54.92%/year
|
€0.31
0.03%/year
|
-€5.18
-0.59%/year
|
€706.51
54.37%/year
|
8.16% | ||
|
8
144 days
|
€632.82
€79.10/share
|
€2,000.10
€250.01/share
|
€1,367.28
216.06%
|
- |
-€3.69
-11.69%
|
€1,363.59
214.23%
|
7.4% | ||
|
11
312 days
|
€2,953.80
€268.53/share
|
€1,872.12
€170.19/share
|
-€1,081.68
-49.16%
|
- |
-€17.11
-0.41%
|
-€1,098.79
-49.63%
|
6.93% | ||
|
1
24 days
|
€1,350.00
€1,350.00/share
|
€1,580.00
€1,580.00/share
|
€230.00
17.04%
|
- |
-€3.90
-4.08%
|
€226.10
16.7%
|
5.85% | ||
|
25
227 days
|
€1,876.04
€75.04/share
|
€1,561.87
€62.47/share
|
-€314.16
-17.69%
|
- |
-€8.61
-0.35%
|
-€322.78
-18.09%
|
5.78% | ||
|
38
160 days
|
€1,553.27
€40.88/share
|
€1,408.72
€37.07/share
|
-€144.55
-10.21%
|
€4.61
0.26%
|
-€11.61
-0.65%
|
-€151.55
-10.65%
|
5.21% | ||
|
18
406 days
|
€942.12
€52.34/share
|
€1,266.14
€70.34/share
|
€324.02
1812.68%/year
|
- |
-€13.60
-533.76%/year
|
€310.42
1278.92%/year
|
4.69% | ||
|
30
402 days
|
€1,136.05
€37.87/share
|
€1,129.94
€37.66/share
|
-€6.12
-0.88%/year
|
€35.79
5.12%/year
|
-€18.62
-2.77%/year
|
€11.06
1.61%/year
|
4.18% | ||
|
21
277 days
|
€880.70
€41.94/share
|
€1,098.07
€52.29/share
|
€217.37
28.55%
|
- |
-€8.69
-1.55%
|
€208.68
27.12%
|
4.06% | ||
|
80
45 days
|
€955.70
€11.95/share
|
€886.72
€11.08/share
|
-€68.98
-7.22%
|
- |
-€3.58
-0.2%
|
-€72.56
-7.56%
|
3.28% | ||
|
6
68 days
|
€901.53
€150.25/share
|
€794.17
€132.36/share
|
-€107.35
-11.91%
|
- |
-€2.73
-0.15%
|
-€110.09
-12.17%
|
2.94% | ||
|
140
314 days
|
€969.50
€6.92/share
|
€775.27
€5.54/share
|
-€194.23
-27.01%
|
- |
-€8.95
-0.93%
|
-€203.19
-27.98%
|
2.87% | ||
|
4
131 days
|
€467.23
€116.81/share
|
€610.31
€152.58/share
|
€143.08
30.62%
|
- |
-€4.07
-1.84%
|
€139.01
29.49%
|
2.26% | ||
|
4
45 days
|
€567.98
€141.99/share
|
€599.22
€149.80/share
|
€31.24
5.5%
|
- |
-€2.55
-0.7%
|
€28.69
5.03%
|
2.22% | ||
|
1
229 days
|
€467.46
€467.46/share
|
€503.37
€503.37/share
|
€35.91
8.95%
|
€0.91
0.24%
|
-€12.39
-3.39%
|
€24.43
5.98%
|
1.86% | ||
|
500
319 days
|
€166.86
€0.33/share
|
€166.86
€0.33/share
|
- | - |
-€6.03
-3.49%
|
-€6.03
-3.49%
|
0.62% |
Cash
| Currency | Balance | Balance in reporting currency |
|---|---|---|
|
Euro
EUR
|
€1,134.82
|
€1,134.82 |
|
US Dollar
USD
|
$12.46
|
€10.87 |
Dividends
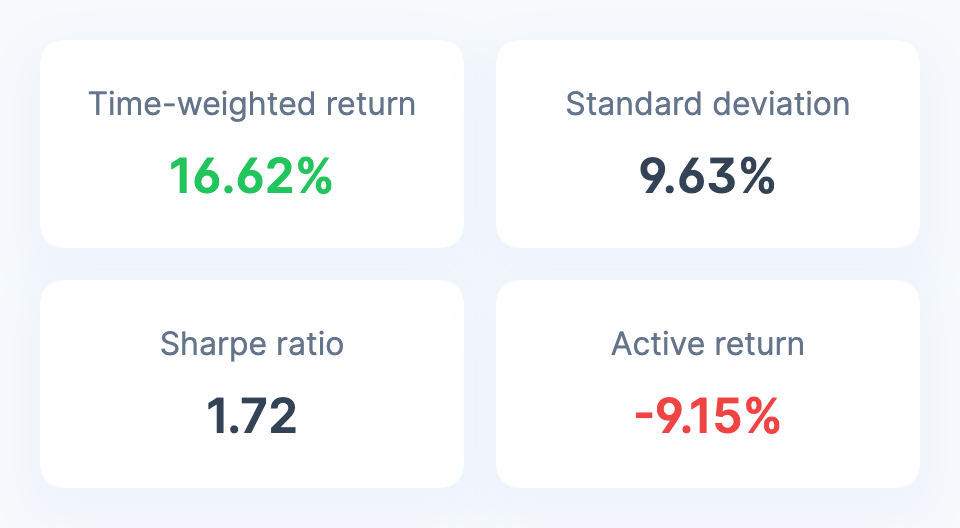
Portfolio analysis
Is your return high enough given the risk you are taking? See your risk, risk-adjusted return and compare the return with a benchmark.
Example
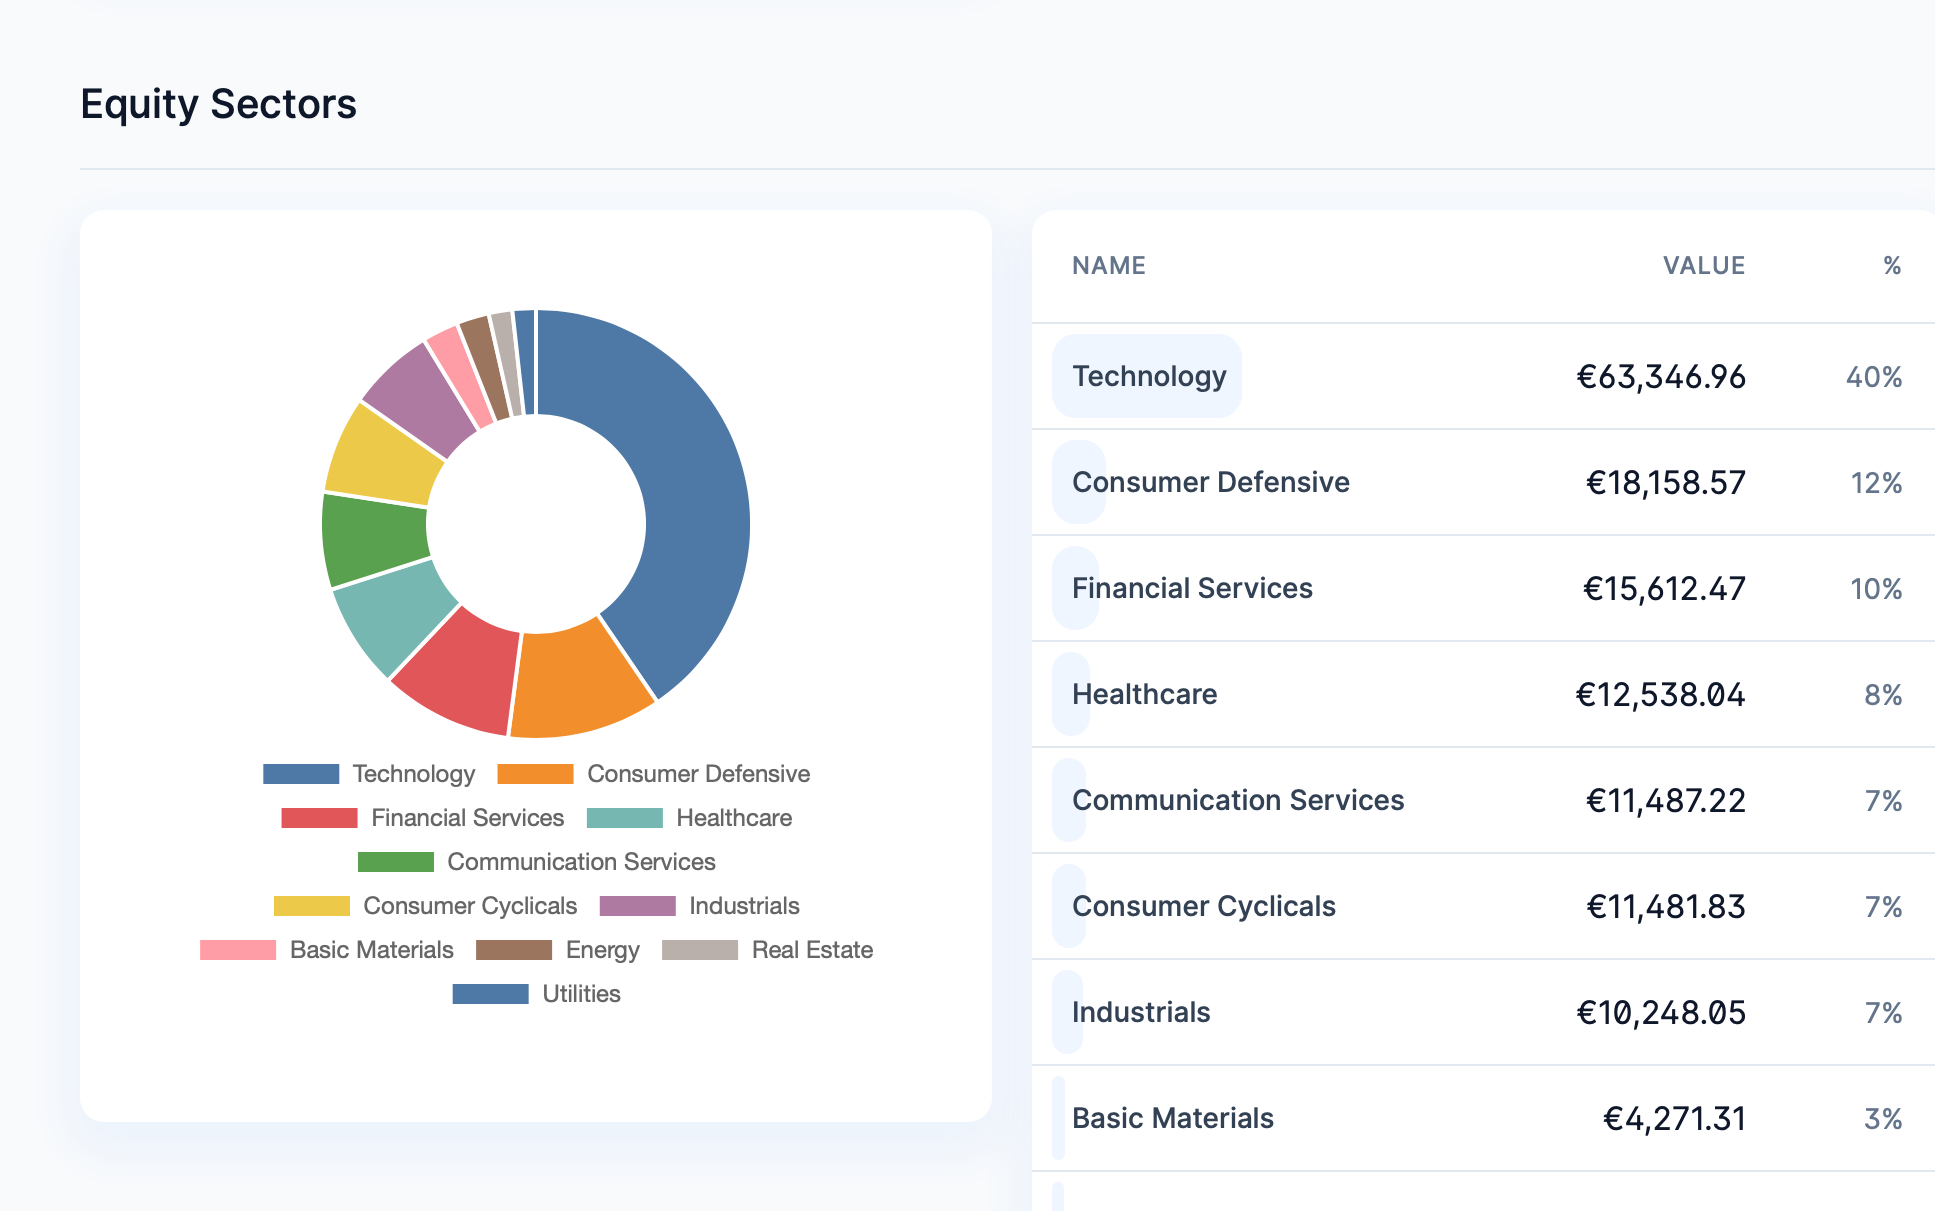
Portfolio breakdown
How well is your portfolio diversified? See a breakdown by a asset class, region, and sector.
Example

Example
| Date | Type | Description | Quantity | Amount | |
|---|---|---|---|---|---|
|
Jun 15, 2026
12:00 AM
|
Dividend |
€1.33
$1.54
|
|||
|
Jun 11, 2026
12:00 AM
|
Dividend |
€9.47
$10.92
|
|||
|
May 29, 2026
1:09 PM
|
Fee |
Costes de transacción y/o externos de DE...
|
-€3.90
-€3.90
|
||
|
May 29, 2026
1:09 PM
|
Buy |
Compra 1 GDR on SK Hynix [email protected] EUR (...
|
1 |
-€1,350.00
-€1,350.00
|
|
|
May 28, 2026
5:06 PM
|
Fee |
Costes de transacción y/o externos de DE...
|
-€1.00
-€1.00
|
||
|
May 28, 2026
5:06 PM
|
Sell |
Venta 8 iShares Physical Gold ETC@74,565...
|
-8 |
€596.52
€596.52
|
|
|
May 27, 2026
3:51 PM
|
Fee |
Costes de transacción y/o externos de DE...
|
-€1.00
-€1.00
|
||
|
May 27, 2026
3:51 PM
|
Sell |
Venta 3 Xtrackers MSCI Korea UCITS 1C ET...
|
-3 |
€650.70
€650.70
|
|
|
May 8, 2026
8:53 PM
|
Currency conversion |
Ingreso Cambio de Divisa
|
€567.98
$668.00
|
||
|
May 8, 2026
8:53 PM
|
Currency conversion |
Retirada Cambio de Divisa
|
-€568.53
-€568.53
|