€94,415.35
2.07%/year
(€8,333.48)
- Price return
-
-0.82%/year-€3,346.45
- Income return
-
2.98%/year€12,022.94
- Cost ratio
-
-0.09%/year-€343.01
No benchmark
Holdings
|
Security
|
Position
Holding period
|
Net cash invested
per share
|
Value
per share
|
Price return
in %
|
Income return
in %
|
Costs amount
in %
|
Net profit/loss
in %
|
Allocation %
|
|---|---|---|---|---|---|---|---|---|
|
205
1536 days
|
€4,889.25
€23.85/share
|
€13,837.54
€67.50/share
|
€8,948.29
28.05%/year
|
€1,153.66
4.36%/year
|
-€17.61
-0.12%/year
|
€10,084.35
32.29%/year
|
14.66% | |
|
25
1588 days
|
€4,933.88
€197.36/share
|
€7,529.46
€301.18/share
|
€2,595.57
10.3%/year
|
€853.57
3.63%/year
|
-€17.83
-0.1%/year
|
€3,431.32
13.83%/year
|
7.97% | |
|
93
1571 days
|
€4,873.18
€52.40/share
|
€7,031.96
€75.61/share
|
€2,158.78
8.89%/year
|
€375.46
1.62%/year
|
-€17.62
-0.1%/year
|
€2,516.62
10.43%/year
|
7.45% | |
|
95
1536 days
|
€4,947.60
€52.08/share
|
€6,425.40
€67.64/share
|
€1,477.80
6.41%/year
|
€320.53
1.44%/year
|
-€17.81
-0.09%/year
|
€1,780.52
7.75%/year
|
6.81% | |
|
7
1508 days
|
€4,386.48
€626.64/share
|
€6,243.10
€891.87/share
|
€1,856.62
8.92%/year
|
€523.42
2.65%/year
|
-€15.85
-0.1%/year
|
€2,364.18
11.48%/year
|
6.61% | |
|
24
1571 days
|
€4,861.29
€202.55/share
|
€5,668.70
€236.20/share
|
€807.40
3.63%/year
|
€494.93
2.27%/year
|
-€17.58
-0.09%/year
|
€1,284.75
5.82%/year
|
6% | |
|
155
1508 days
|
€4,870.10
€31.42/share
|
€4,832.50
€31.18/share
|
-€37.60
-0.19%/year
|
€892.21
4.53%/year
|
-€17.54
-0.1%/year
|
€837.07
4.26%/year
|
5.12% | |
|
135
1571 days
|
€4,860.24
€36.00/share
|
€4,617.49
€34.20/share
|
-€242.75
-1.18%/year
|
€482.82
2.36%/year
|
-€17.58
-0.09%/year
|
€222.49
1.09%/year
|
4.89% | |
|
90
1570 days
|
€4,947.24
€54.97/share
|
€4,590.40
€51.00/share
|
-€356.84
-1.73%/year
|
€823.59
4.02%/year
|
-€17.77
-0.09%/year
|
€448.98
2.21%/year
|
4.86% | |
|
35
1536 days
|
€4,924.15
€140.69/share
|
€4,585.28
€131.01/share
|
-€338.87
-1.68%/year
|
€622.95
3.12%/year
|
-€17.73
-0.09%/year
|
€266.34
1.35%/year
|
4.86% | |
|
47
1508 days
|
€4,979.65
€105.95/share
|
€4,575.70
€97.36/share
|
-€403.95
-2.03%/year
|
€452.78
2.27%/year
|
-€17.93
-0.09%/year
|
€30.90
0.16%/year
|
4.85% | |
|
125
1508 days
|
€4,847.50
€38.78/share
|
€4,449.22
€35.59/share
|
-€398.28
-2.05%/year
|
€357.27
1.84%/year
|
-€17.46
-0.09%/year
|
-€58.47
-0.3%/year
|
4.71% | |
|
107
1571 days
|
€4,900.04
€45.79/share
|
€4,222.13
€39.46/share
|
-€677.91
-3.4%/year
|
€1,111.32
5.62%/year
|
-€17.72
-0.1%/year
|
€415.69
2.14%/year
|
4.47% | |
|
55
1571 days
|
€4,940.55
€89.83/share
|
€3,064.47
€55.72/share
|
-€1,876.09
-10.5%/year
|
€791.59
4.36%/year
|
-€17.86
-0.09%/year
|
-€1,102.35
-6.22%/year
|
3.25% | |
|
110
1571 days
|
€4,892.12
€44.47/share
|
€2,762.82
€25.12/share
|
-€2,129.30
-12.43%/year
|
€539.18
3.08%/year
|
-€17.19
-0.08%/year
|
-€1,607.30
-9.42%/year
|
2.93% | |
|
51
1571 days
|
€4,933.82
€96.74/share
|
€2,503.53
€49.09/share
|
-€2,430.29
-14.58%/year
|
€521.67
3.03%/year
|
-€17.83
-0.08%/year
|
-€1,926.44
-11.62%/year
|
2.65% | |
|
35
1507 days
|
€4,964.75
€141.85/share
|
€2,116.56
€60.47/share
|
-€2,848.19
-18.66%/year
|
€415.74
2.64%/year
|
-€17.87
-0.08%/year
|
-€2,450.32
-16.08%/year
|
2.24% | |
|
114
1410 days
|
€4,967.32
€43.57/share
|
€2,029.33
€17.80/share
|
-€2,937.99
-20.68%/year
|
€299.07
1.74%/year
|
-€8.72
-0.04%/year
|
-€2,647.64
-18.98%/year
|
2.15% | |
|
36
1571 days
|
€4,927.13
€136.86/share
|
€1,800.15
€50.00/share
|
-€3,126.98
-20.86%/year
|
€370.78
2.43%/year
|
-€17.81
-0.07%/year
|
-€2,774.01
-18.49%/year
|
1.91% | |
|
150
1536 days
|
€4,915.50
€32.77/share
|
€1,529.63
€10.20/share
|
-€3,385.87
-24.23%/year
|
€620.40
3.58%/year
|
-€17.70
-0.08%/year
|
-€2,783.17
-20.71%/year
|
1.62% |
Cash balances not available
Cash balances are not available because of the following reasons:
- Deposits/withdrawals weren't exported from your DEGIRO account. To fix the issue, please make sure to export all transactions from your account.
- There are no recorded deposits for trades entered manually or imported from a custom CSV file. To fix that, please manually enter all your deposits for those trades.
-
Some of your transactions were imported from
Transactions.csvDEGIRO exports which do not include cash transactions such as deposits. To fix the issue, reimport all your transactions fromAccount.csvexports
Dividends
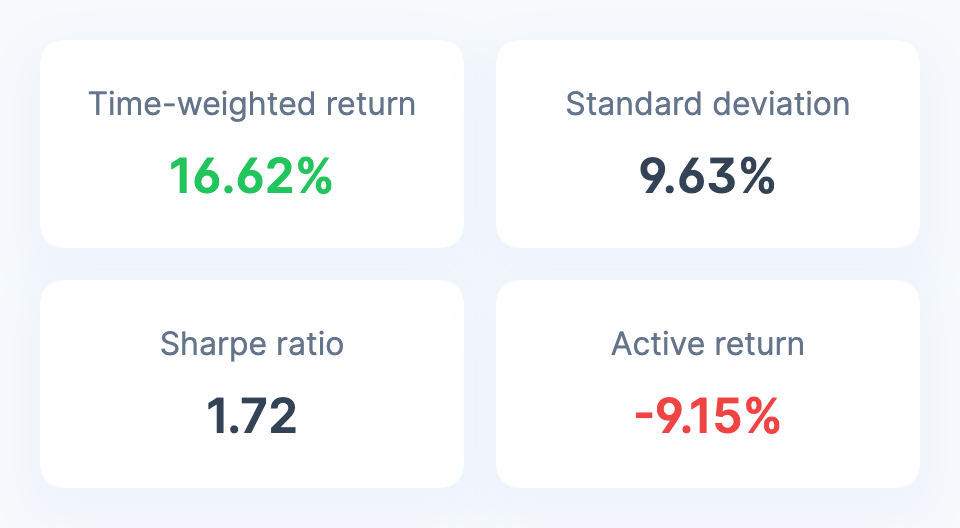
Portfolio analysis
Is your return high enough given the risk you are taking? See your risk, risk-adjusted return and compare the return with a benchmark.
Example
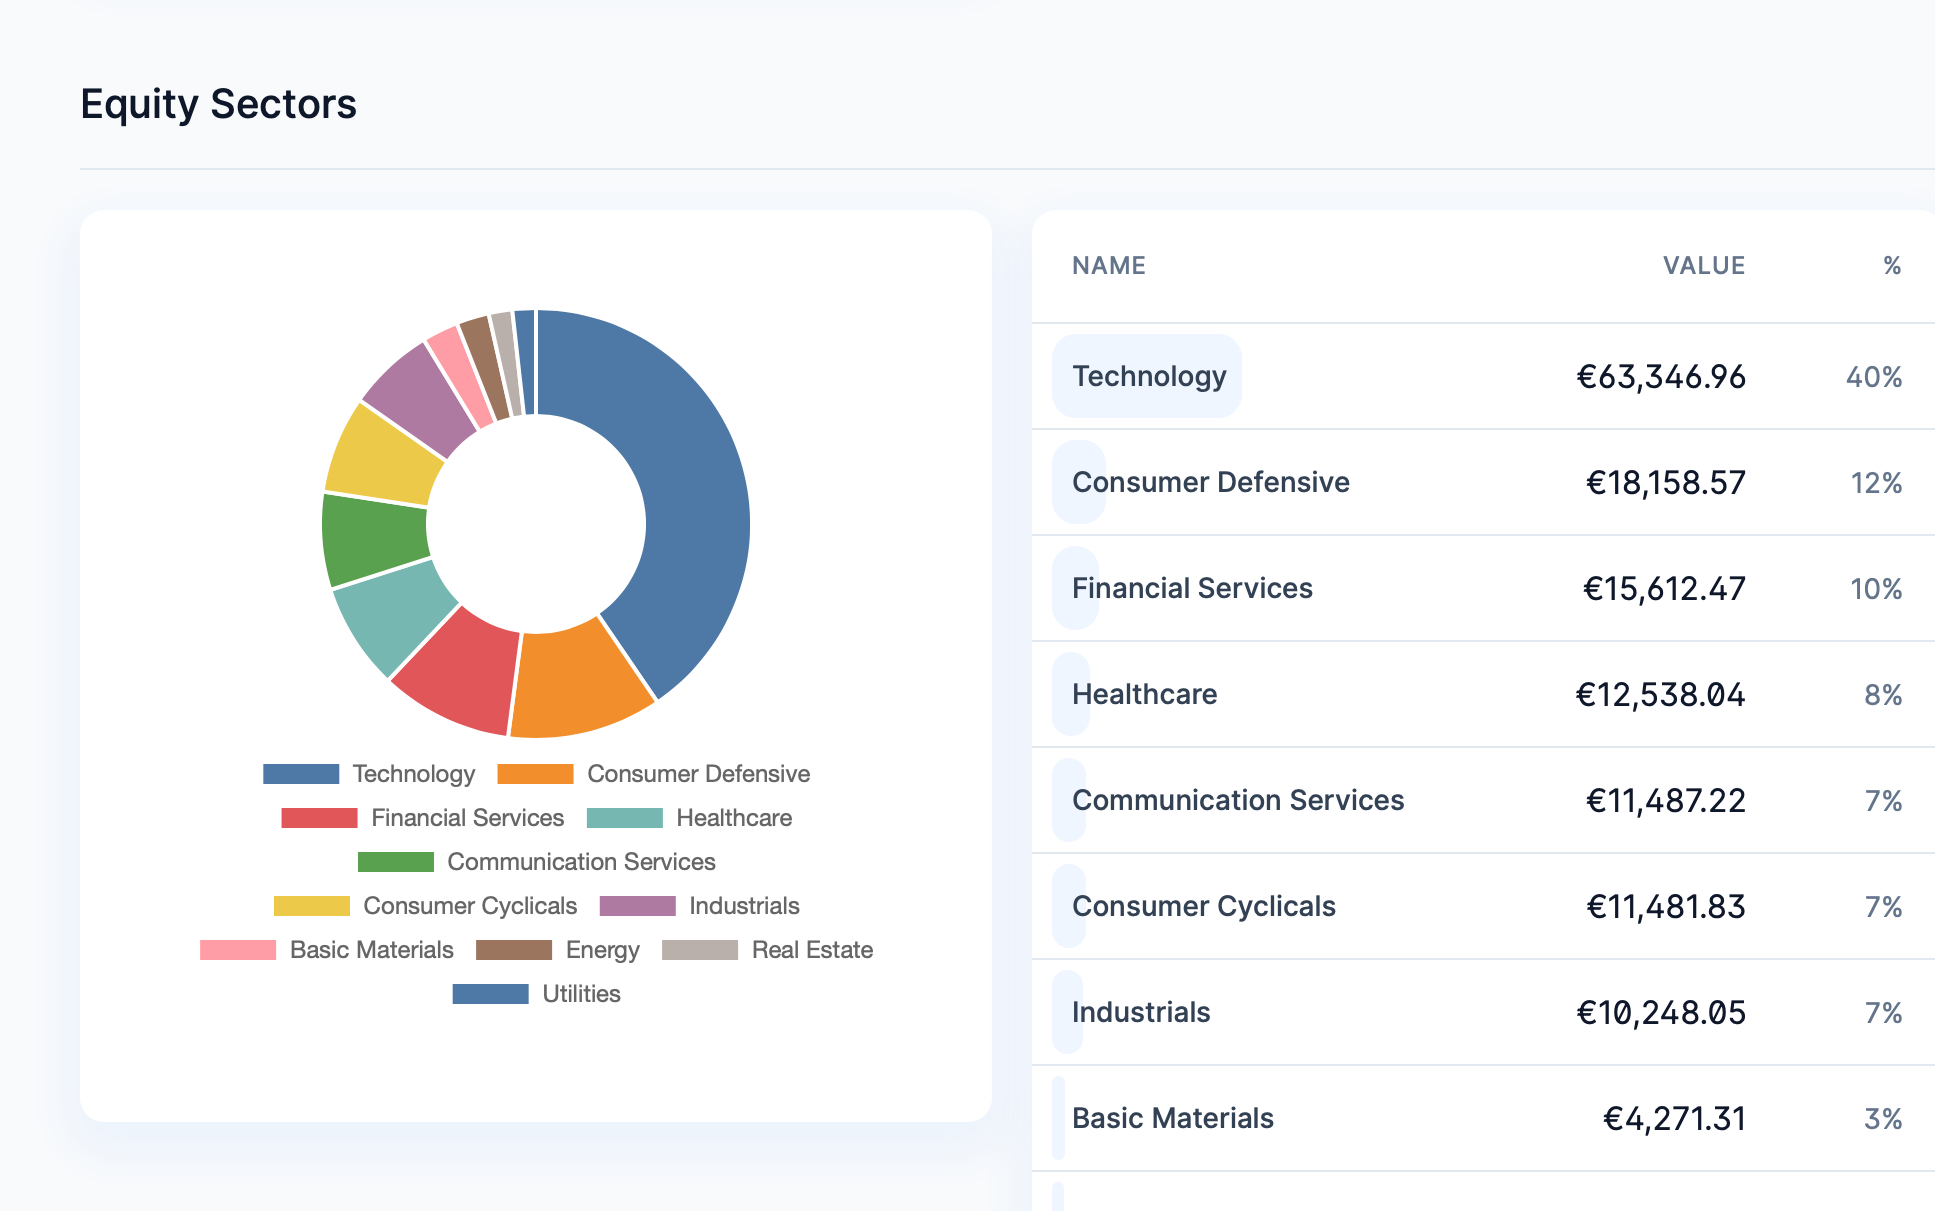
Portfolio breakdown
How well is your portfolio diversified? See a breakdown by a asset class, region, and sector.
Example

Example
| Date | Type | Description | Quantity | Amount | |
|---|---|---|---|---|---|
|
Apr 22, 2026
12:00 AM
|
Dividend |
€30.77
$36.30
|
|||
|
Apr 15, 2026
12:00 AM
|
Dividend |
€6.37
$7.50
|
|||
|
Apr 14, 2026
12:00 AM
|
Dividend |
€44.77
$52.80
|
|||
|
Apr 1, 2026
12:00 AM
|
Dividend |
€50.09
$58.12
|
|||
|
Mar 31, 2026
12:00 AM
|
Dividend |
€22.83
$26.25
|
|||
|
Mar 24, 2026
12:00 AM
|
Dividend |
€25.10
$29.05
|
|||
|
Mar 24, 2026
12:00 AM
|
Dividend |
€34.66
$40.11
|
|||
|
Mar 19, 2026
12:00 AM
|
Dividend |
€8.93
$10.26
|
|||
|
Mar 19, 2026
12:00 AM
|
Dividend |
€32.59
$37.44
|
|||
|
Mar 17, 2026
12:00 AM
|
Dividend |
€22.17
$25.56
|