€110,518.57
5.12%/year
(€24,743.10)
- Portfolio performance
- Volatility
- Risk-adjusted return
- Active return
- Net invested capital
- Price contribution
- Income contribution
- Cost contribution
Holdings
|
Security
|
Position
Holding period
|
Net cash invested
per share
|
Value
per share
|
Holding return (MWR)
Net profit/loss
|
Allocation %
|
|---|---|---|---|---|---|
|
205
1734 days
|
€4,889.25
€23.85/share
|
€13,506.55
€65.89/share
|
28.11%/year
€9,923.95
|
12.22% | |
|
25
1786 days
|
€4,933.88
€197.36/share
|
€10,252.14
€410.09/share
|
19.49%/year
€6,262.47
|
9.28% | |
|
95
1734 days
|
€4,947.60
€52.08/share
|
€8,902.44
€93.71/share
|
14.39%/year
€4,300.17
|
8.06% | |
|
93
1769 days
|
€4,873.18
€52.40/share
|
€6,899.60
€74.19/share
|
8.99%/year
€2,436.04
|
6.24% | |
|
135
1769 days
|
€4,860.24
€36.00/share
|
€6,455.32
€47.82/share
|
8.23%/year
€2,162.63
|
5.84% | |
|
24
1769 days
|
€4,861.29
€202.55/share
|
€6,446.47
€268.60/share
|
8.11%/year
€2,128.01
|
5.83% | |
|
35
1734 days
|
€4,924.15
€140.69/share
|
€5,855.27
€167.29/share
|
6.48%/year
€1,583.48
|
5.3% | |
|
47
1706 days
|
€4,979.65
€105.95/share
|
€5,161.88
€109.83/share
|
2.88%/year
€675.93
|
4.67% | |
|
155
1706 days
|
€4,870.10
€31.42/share
|
€5,139.97
€33.16/share
|
5.48%/year
€1,247.04
|
4.65% | |
|
90
1768 days
|
€4,947.24
€54.97/share
|
€5,062.10
€56.25/share
|
4.49%/year
€1,068.83
|
4.58% | |
|
150
1734 days
|
€4,915.50
€32.77/share
|
€4,915.50
€32.77/share
|
-0.08%/year
-€17.70
|
4.45% | |
|
55
1769 days
|
€4,940.55
€89.83/share
|
€4,870.81
€88.56/share
|
3.39%/year
€797.37
|
4.41% | |
|
125
1706 days
|
€4,847.50
€38.78/share
|
€4,637.38
€37.10/share
|
0.79%/year
€175.05
|
4.2% | |
|
107
1769 days
|
€4,900.04
€45.79/share
|
€4,396.69
€41.09/share
|
3.54%/year
€788.20
|
3.98% | |
|
7
1706 days
|
€4,386.48
€626.64/share
|
€4,386.48
€626.64/share
|
-0.08%/year
-€15.85
|
3.97% | |
|
35
1705 days
|
€4,964.75
€141.85/share
|
€3,594.49
€102.70/share
|
-4.52%/year
-€921.24
|
3.25% | |
|
51
1769 days
|
€4,933.82
€96.74/share
|
€2,921.69
€57.29/share
|
-7.42%/year
-€1,448.35
|
2.64% | |
|
36
1769 days
|
€4,927.13
€136.86/share
|
€2,604.74
€72.35/share
|
-10.38%/year
-€1,947.38
|
2.36% | |
|
110
1769 days
|
€4,892.12
€44.47/share
|
€2,445.21
€22.23/share
|
-10.16%/year
-€1,860.32
|
2.21% | |
|
114
1608 days
|
€4,967.32
€43.57/share
|
€2,063.86
€18.10/share
|
-16.45%/year
-€2,595.22
|
1.87% |
Cash balances not available
Cash balances are not available because of the following reasons:
- Deposits/withdrawals weren't exported from your DEGIRO account. To fix the issue, please make sure to export all transactions from your account.
- There are no recorded deposits for trades entered manually or imported from a custom CSV file. To fix that, please manually enter all your deposits for those trades.
-
Some of your transactions were imported from
Transactions.csvDEGIRO exports which do not include cash transactions such as deposits. To fix the issue, reimport all your transactions fromAccount.csvexports
Dividends
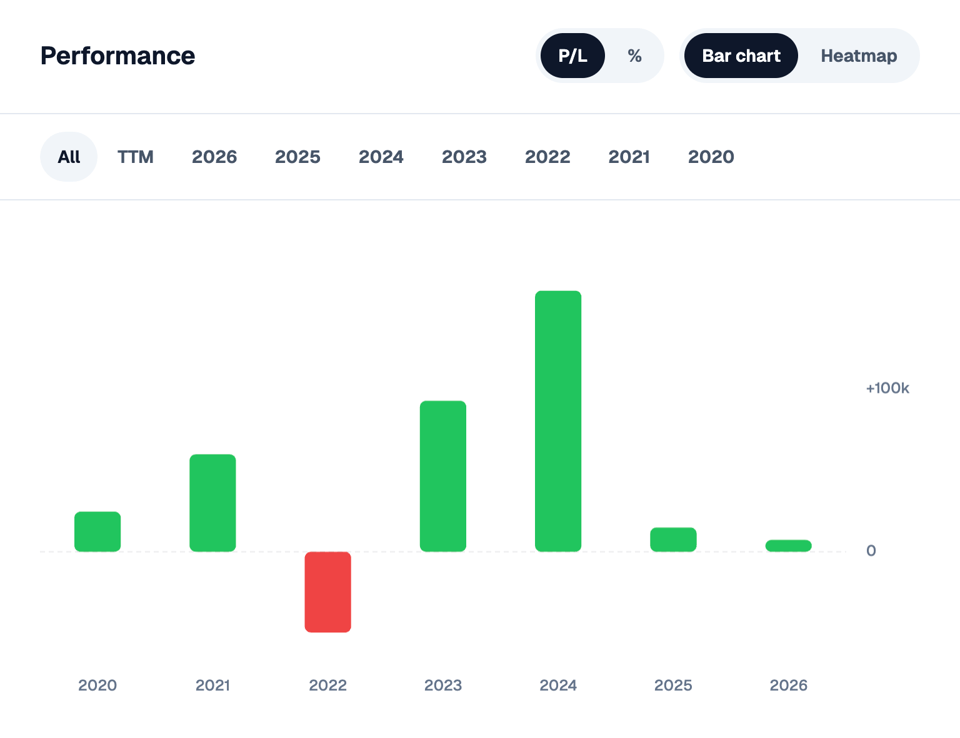
Performance
See how your portfolio performed year by year with a bar chart and heatmap of your returns.
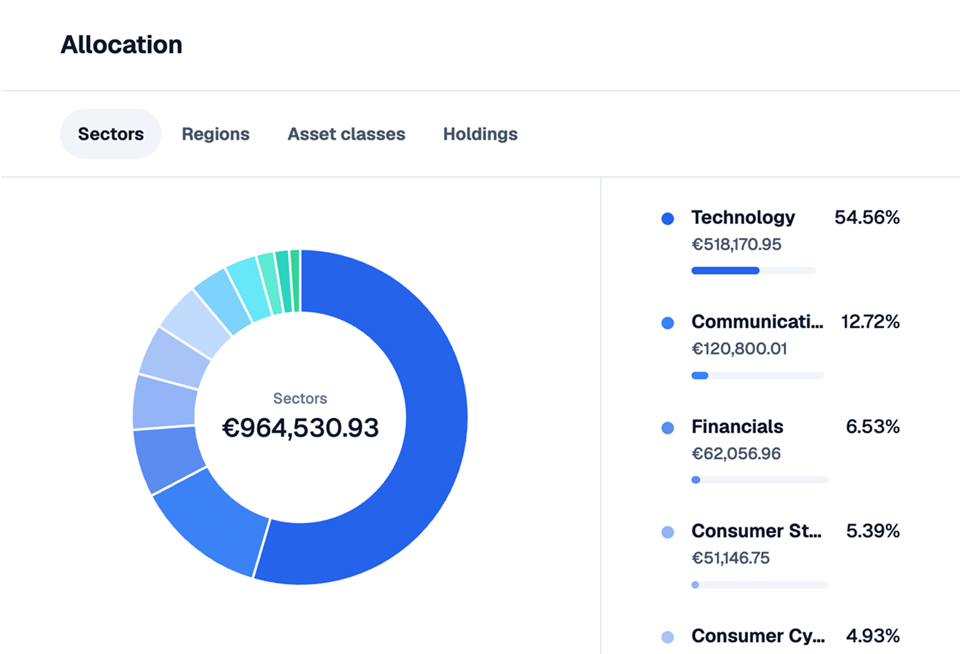
Allocation
See how the portfolio is diversified by asset class, region, sector, and holding.
Tax report
- Realized gains
- Unrealized gains
- Income
- Costs
| Date | Type | Description | Quantity | Amount | |
|---|---|---|---|---|---|
|
Nov 2, 2026
12:00 AM
|
Dividend |
€67.54
$75.76
|
|||
|
Nov 2, 2026
12:00 AM
|
Dividend |
€50.55
$56.70
|
|||
|
Nov 2, 2026
12:00 AM
|
Dividend |
€34.91
$39.15
|
|||
|
Oct 28, 2026
12:00 AM
|
Dividend |
€32.61
$36.30
|
|||
|
Oct 8, 2026
12:00 AM
|
Dividend |
€47.20
$52.80
|
|||
|
Oct 1, 2026
12:00 AM
|
Dividend |
€51.45
$58.12
|
|||
|
Sep 23, 2026
12:00 AM
|
Dividend |
€32.81
$37.44
|
|||
|
Sep 22, 2026
12:00 AM
|
Dividend |
€25.65
$29.40
|
|||
|
Sep 17, 2026
12:00 AM
|
Dividend |
€8.94
$10.26
|
|||
|
Sep 15, 2026
12:00 AM
|
Dividend |
€22.75
$26.25
|