
Free
$0 /month
or $0 /year
- Unlimited trades
- Unlimited brokerage accounts
- 1 portfolio
- Performance tracking
- Automatic dividend & split tracking
- Chat support
Get a better view of your stocks, ETFs, and cryptocurrencies with an easy-to-use portfolio tracker.
Import your trades from the following brokers, from a CSV file or add them manually.
Most brokers don't show you the numbers that matter in the long term. We show you your true net annualized return rate, annualized fee ratio, capital gains yield, and dividend yield.
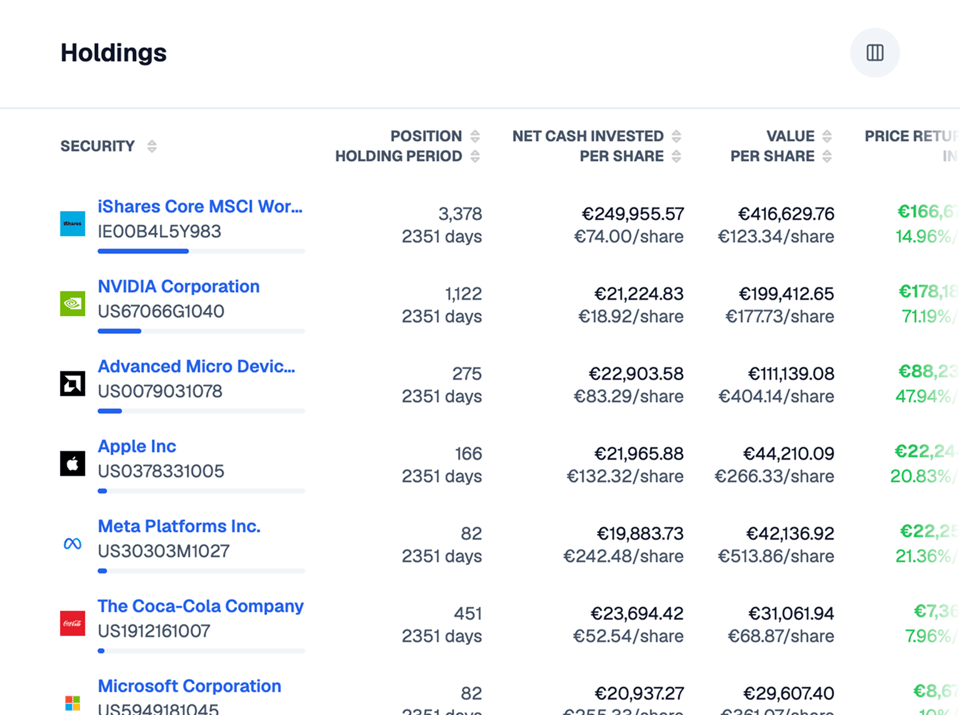
Get a perfect overview of all your investments in one place. Easily see your asset allocation and how well each asset performs. For each holding, we show you its absolute and annualized net return including fees and dividends.
You no longer have to manually enter your dividends into a spreadsheet. All dividends and other corporate actions get automatically imported into your portfolio.
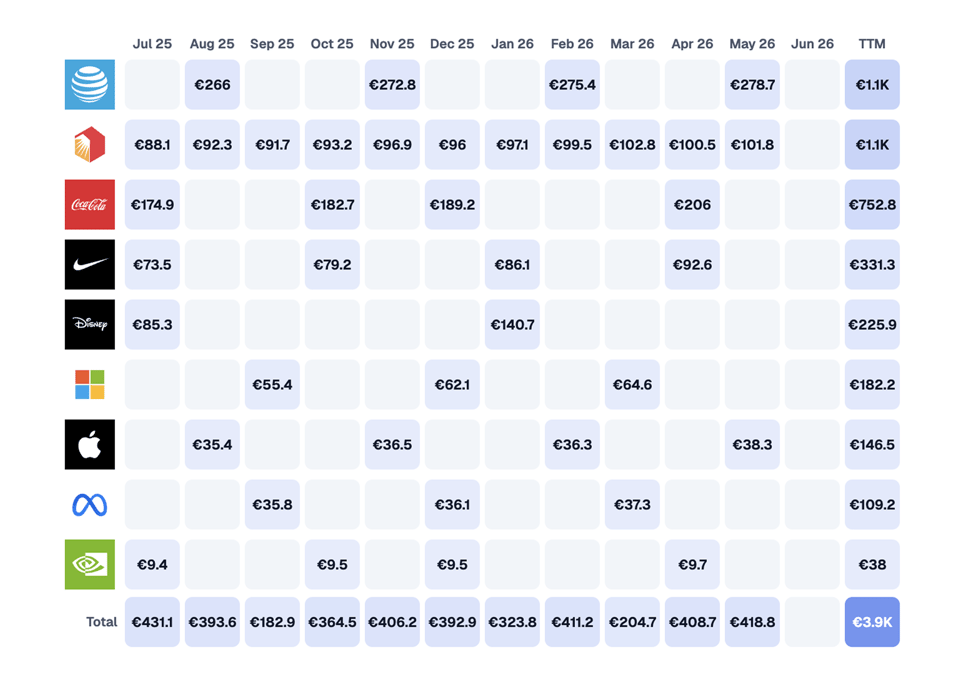
Track your upcoming dividends so that you can plan which holdings to keep and which to sell.
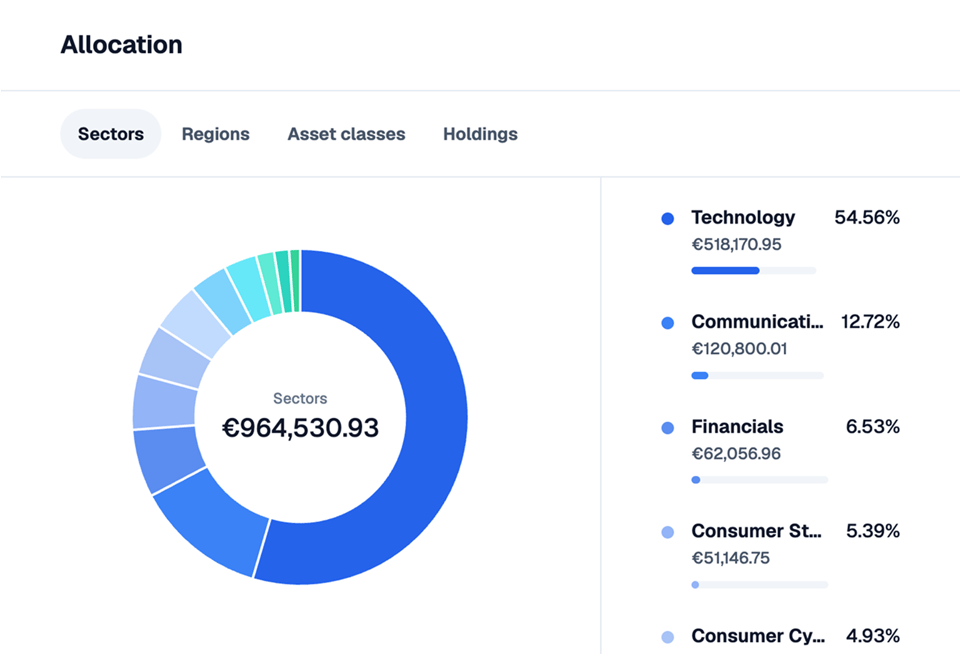
Make sure your portfolio is well diversified by breaking it down by asset class, region and sector
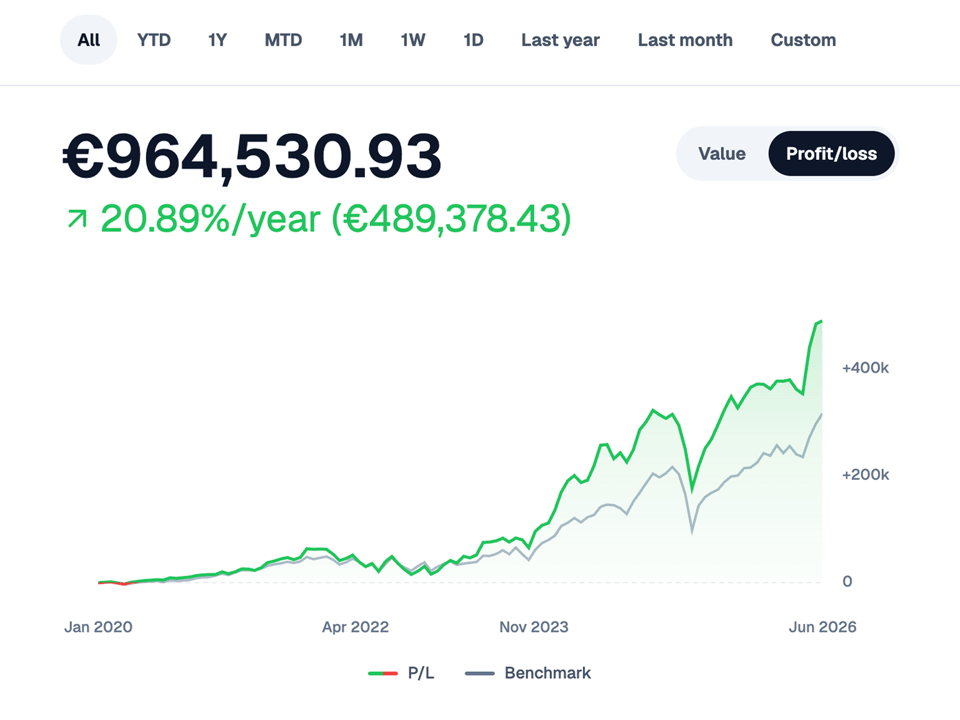
See how would your portfolio perform if you invested the same amounts in a benchmark of your choice such as S&P 500.
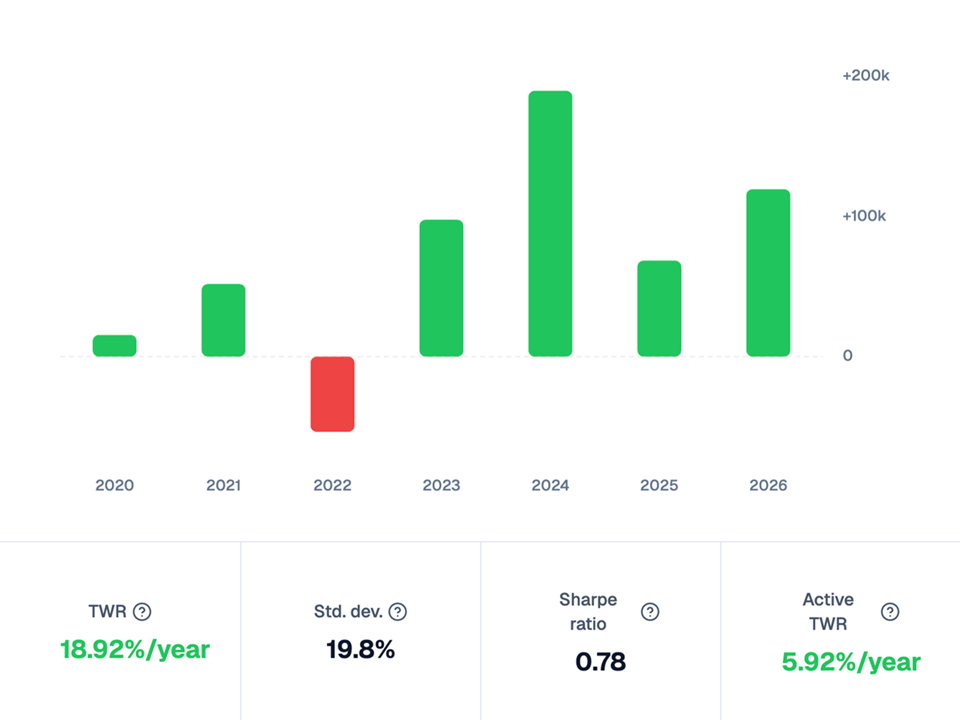
Track your portfolio risk, see your risk-adjusted return and compare it to a benchmark.
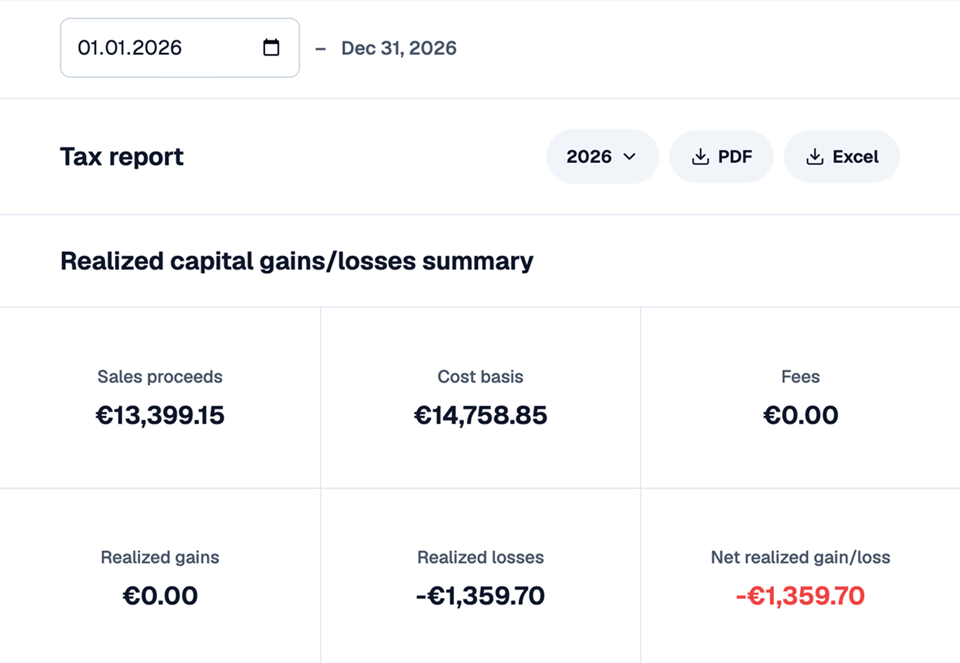
Doing your taxes used to be a hassle. Not anymore. With our detailed tax report, you have everything you need to file your taxes. See a sample tax report.
You don't have to enter your trades manually. Just drag & drop your account statements from your broker or spreadsheets. We do the rest.
Don't take our word for it. See what our customers have to say.
Great Customer Care Team!
It just works.
I can track the performance of my portfolio and understand its breakdown so that I know where to make new investments.
It automatically parses the trades I import from DeGiro and then automatically keeps track of the evolution of each position, dividends, etc. without any effort from my side. It is also great not to have to worry about currency conversions
Investment tracking platform for my different platforms. I see my investment info in one place. I can easily print and declare tax report to my country authority.
You have built a wonderful tool - the analytics have really helped me understand my portfolio a bit better. You should be very proud of your work!
Very usefull app to follow one or more portfolios. The support is excellent and help with any questions and issues uploading portfolios. Responses are quick and helpfull.
All in all a reliable portfolio service with good support.
it's incredibly good
The simplest, most straightforward
I logged in every portfolio tracker I could find and will stay with this one. Very ergonomic, straightforward, relevant KPI easily accessible. Great job from the creator. Looking forward to the updates coming. Very new yet very promising.
FYI: I am using DEGIRO.
I appreciate the work you put into the site, nothing comes quite close to its simplicity and functionality.
A one stop shop for portfolio performance, even for stock purchased through different brokers.
easy way to track your dividends
$0 /month
or $0 /year
$9 /month
or $90 /year 2 months for free
Ask us at [email protected] or via the chat.