Understand your portfolio's performance
Track numbers that matter in the long-term. We show you your true net annualized return rate, annualized fee ratio, capital gains yield, and dividend yield.
Existing customer? Sign in
Track numbers that matter in the long-term. We show you your true net annualized return rate, annualized fee ratio, capital gains yield, and dividend yield.
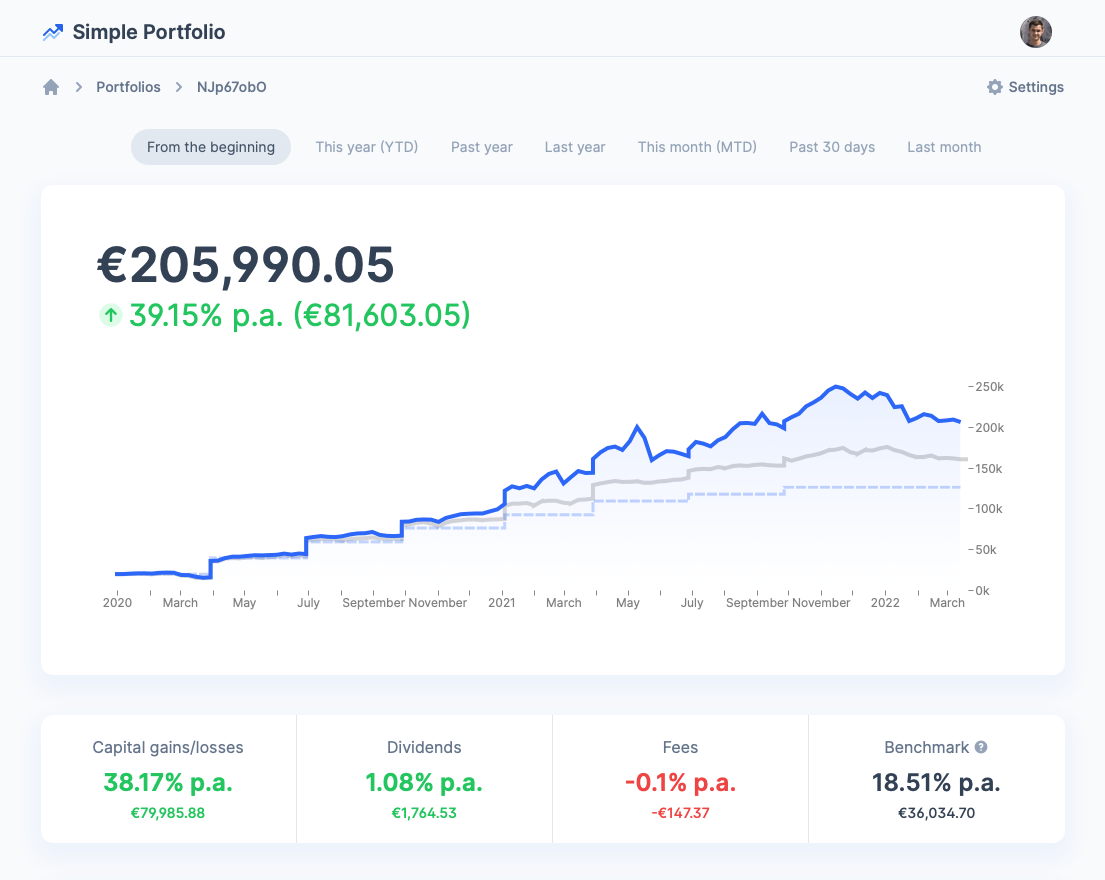
See your annualized portfolio performance over any period and break it down to capital gains, dividend yield and fees ratio.
See how your brokerage fees impact your long-term returns.
See how would your portfolio perform if you invested the same amounts in a benchmark of your choice such as S&P 500 or MSCI World index.
Import your trades from the following brokers, from a CSV file or add them manually.
Most brokers don't show you the numbers that matter in the long term. We show you your true net annualized return rate, annualized fee ratio, capital gains yield, and dividend yield.

Make sure your portfolio is well diversified by breaking it down by asset class, region and sector
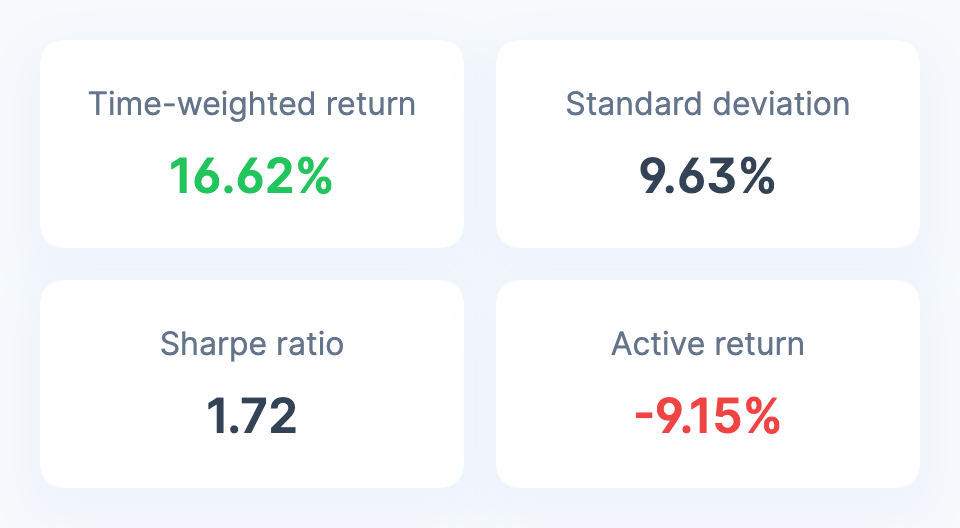
Track your portfolio risk, see your risk-adjusted return and compare it to a benchmark.
You no longer have to manually enter your dividends into a spreadsheet. All dividends and other corporate actions get automatically imported into your portfolio.
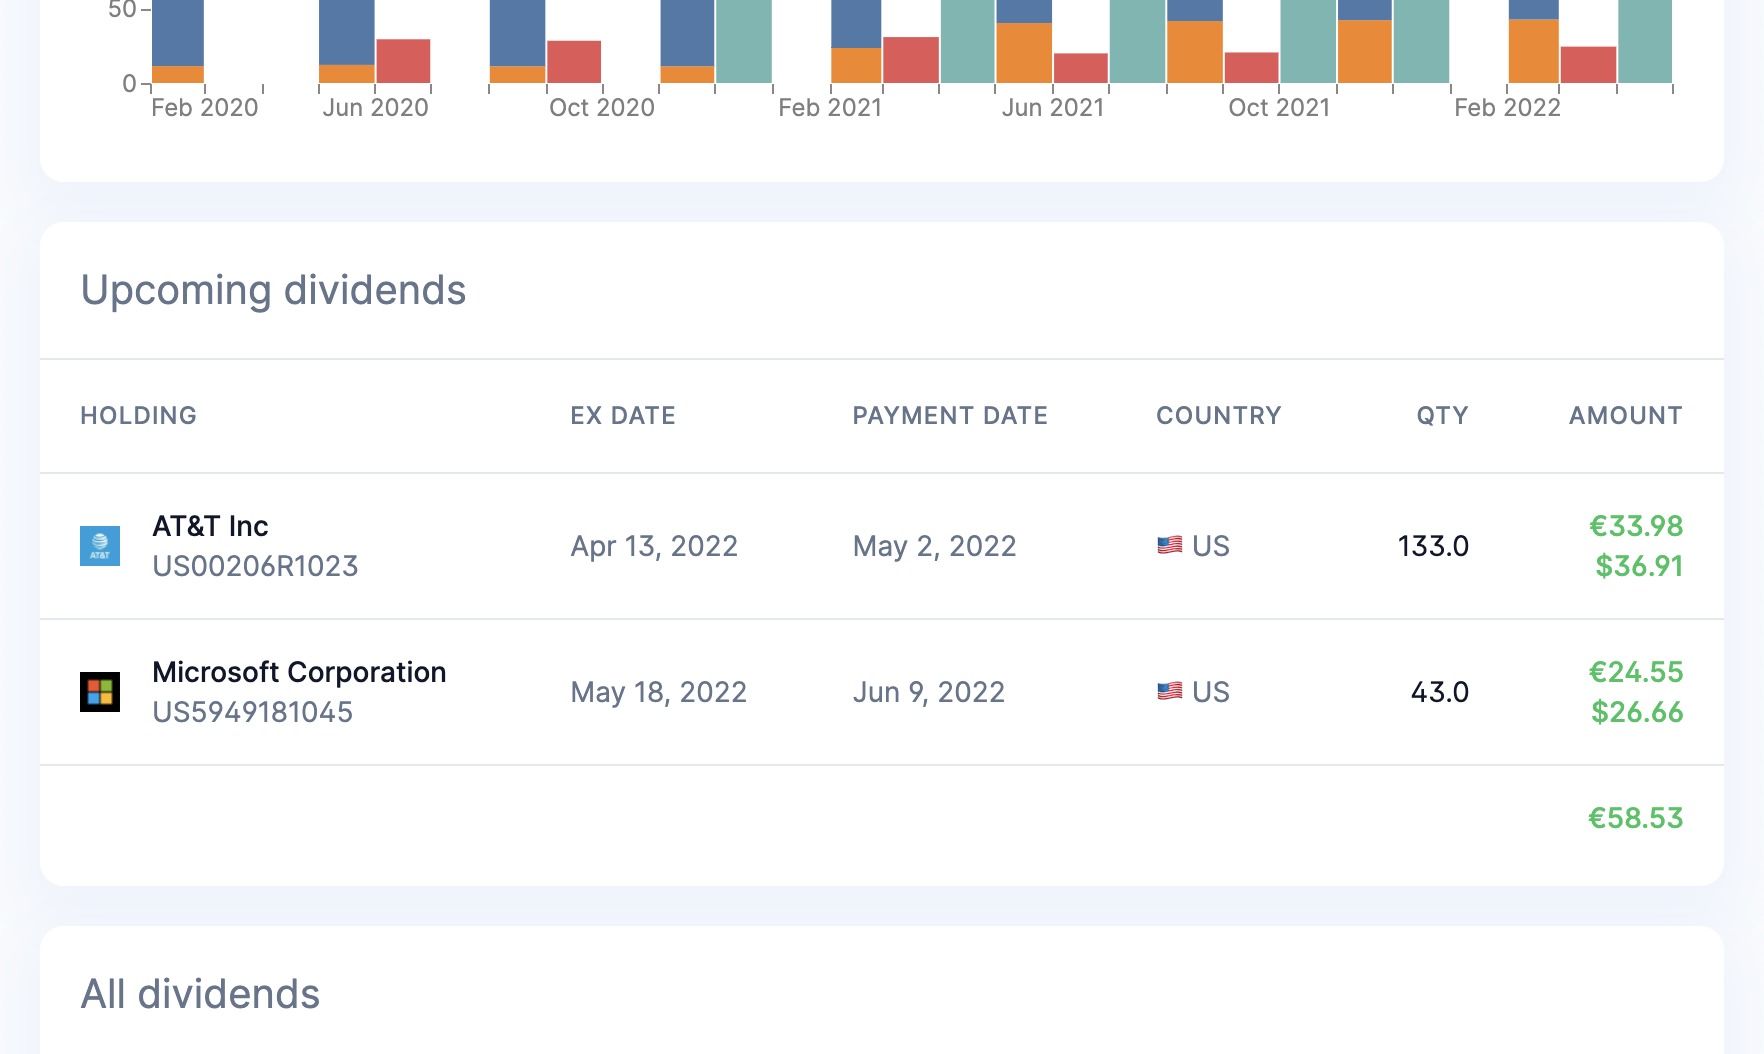
Track your upcoming dividends so that you can plan which holdings to keep and which to sell.
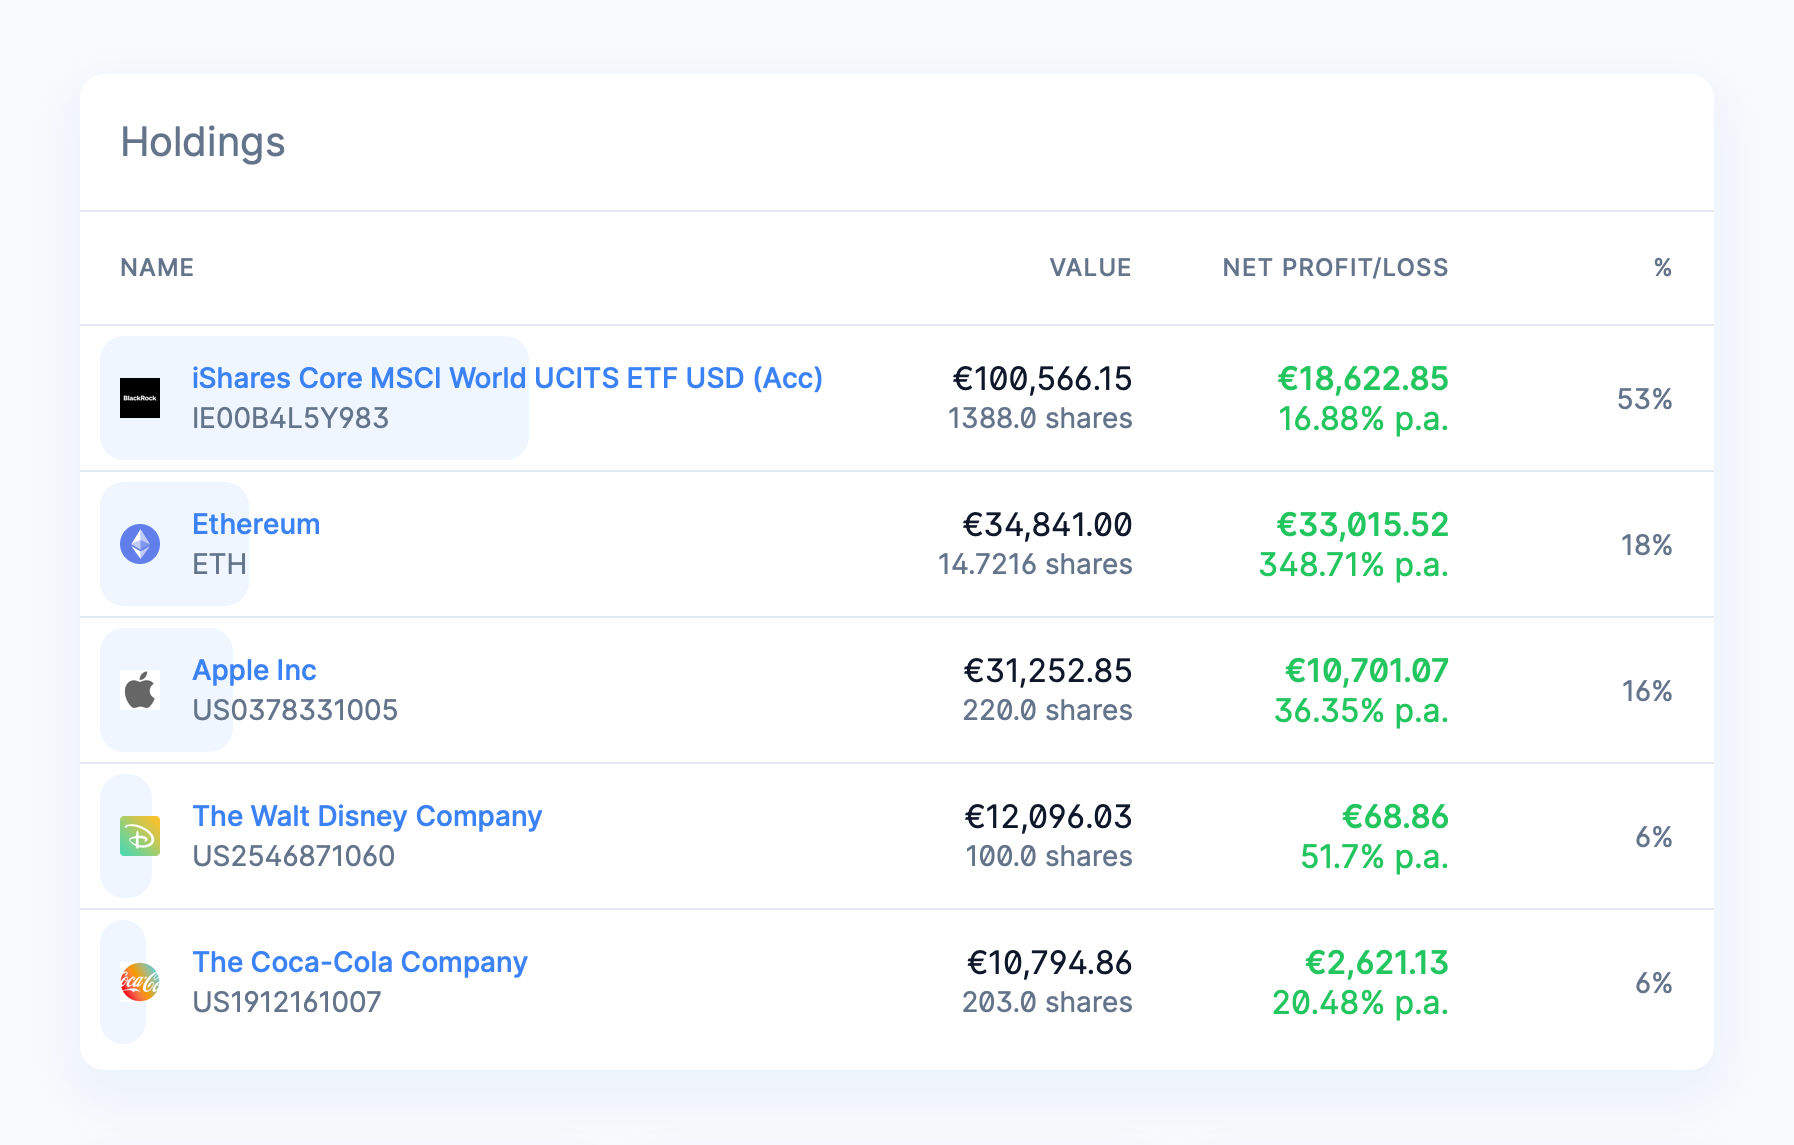
Get a perfect overview of all your investments in one place. Easily see your asset allocation and how well each asset performs. For each holding, we show you its absolute and annualized net return including fees and dividends.

Doing your taxes used to be a hassle. Not anymore. With our detailed tax report, you have everything you need to file your taxes. See a sample tax report.
You don't have to enter your trades manually. Just drag & drop your account statements from your broker or spreadsheets. We do the rest.
Don't take our word for it. See what our customers have to say.
Just found this tool on Reddit. Looks absolutely fantastic. I'm currently trading through Degiro and their UI for portfolio tracking is so awful. I'm especially impressed by your UI.
Thanks for creating this app. It helps me consolidate my different Portfolios into one place. I had difficulties in the past trying to consolidate Trading 212 and Degiro. Your app is the only app that can do this almost accurately.
You're doing a great product.
I enjoy your application.
Great application for tracking your portfolio over longer periods of time and getting useful metrics on the performance of your portfolio.
Intuitive and useful platform
Easy to use and does exactly what I wanted it to do for free. Very quick and effective responses from support team when I ran into issues
I'm a paying customer and I'm thrilled with this product; no one has seemed to crack tracking investments from DEGIRO (even DEGIRO themselves have struggled with this), this app gives me a simple breakdown of my performance compared to major indices, and my allocation/diversity split. I'm glad to be using the product and excited to see what features come along in the future.
TBH I'm surprised by how fast it is. I used to use a different desktop app before and it took ages to calculate the values for different time frames. And the UX... I love it
Great app for tracking multiple portfolios in one place.
I use Simple Portfolio for more than a year. When I saw the value and converted into a paid customer.
The quality of the charts, the data, the design of the whole app and especially the monthly newsletter is the reason to use the app.
Also the customer support is very responsive and listens to user feedback and updates the app regularly.
Highly recommend it.
all my stocks in one app
€ 0 /month
or € 0/year
Recommended
€ 8 /month
or € 80/year 2 months for free
Ask us at [email protected] or via the chat.