
Know your true performance
See your annualized portfolio performance over any period and break it down to capital gains, dividend yield and fees ratio.
Track numbers that matter in the long-term. We show you your true net annualized return rate, annualized fee ratio, capital gains yield, and dividend yield.
See your annualized portfolio performance over any period and break it down to capital gains, dividend yield and fees ratio.
See how your brokerage fees impact your long-term returns.
See how would your portfolio perform if you invested the same amounts in a benchmark of your choice such as S&P 500 or MSCI World index.
Import your trades from the following brokers, from a CSV file or add them manually.
Most brokers don't show you the numbers that matter in the long term. We show you your true net annualized return rate, annualized fee ratio, capital gains yield, and dividend yield.
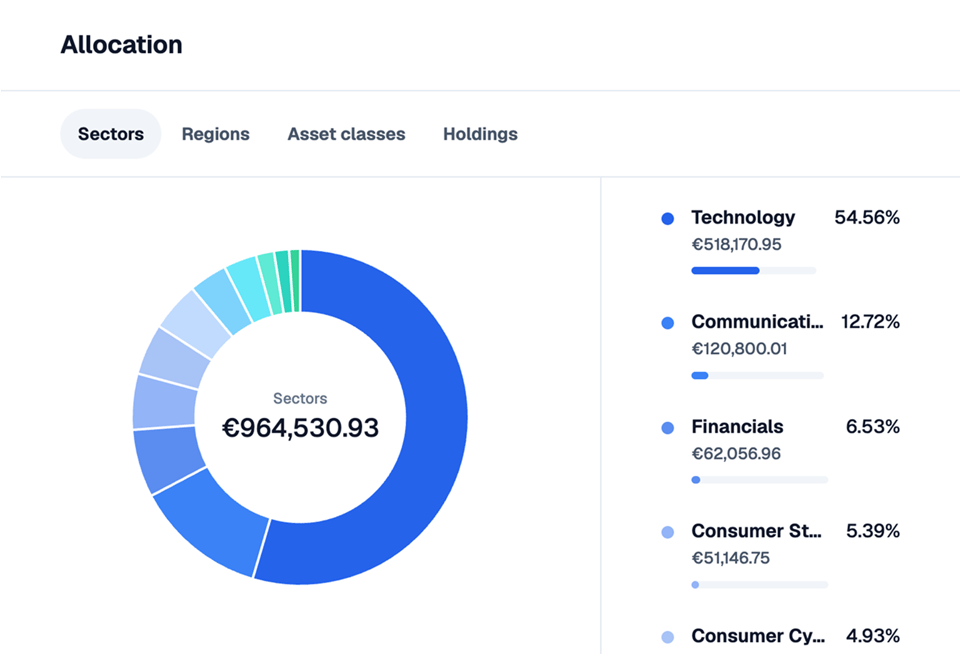
Make sure your portfolio is well diversified by breaking it down by asset class, region and sector
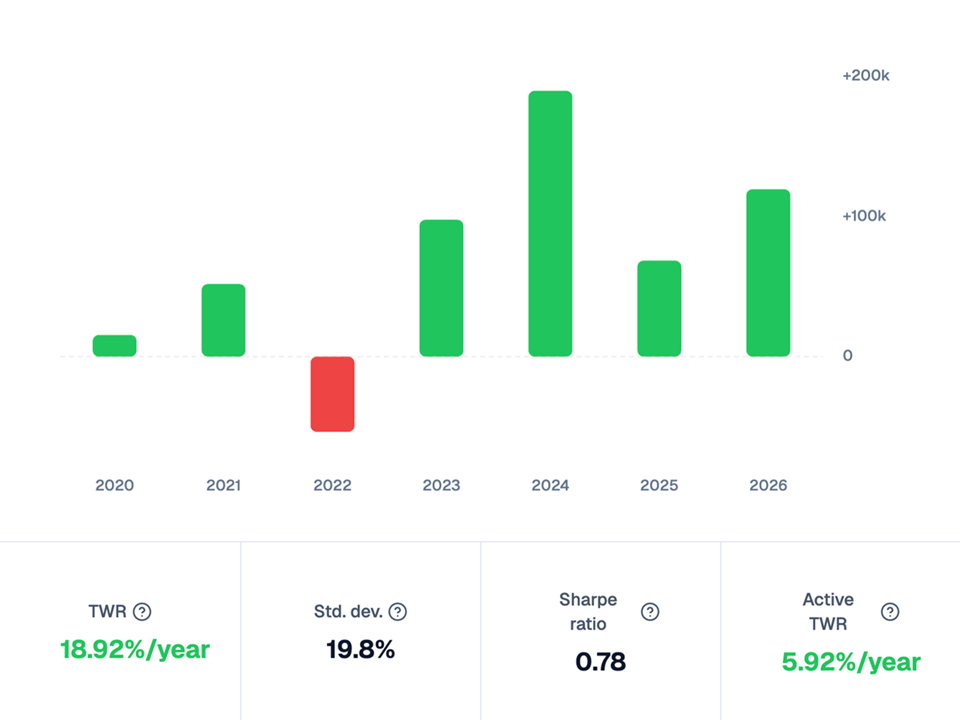
Track your portfolio risk, see your risk-adjusted return and compare it to a benchmark.
You no longer have to manually enter your dividends into a spreadsheet. All dividends and other corporate actions get automatically imported into your portfolio.
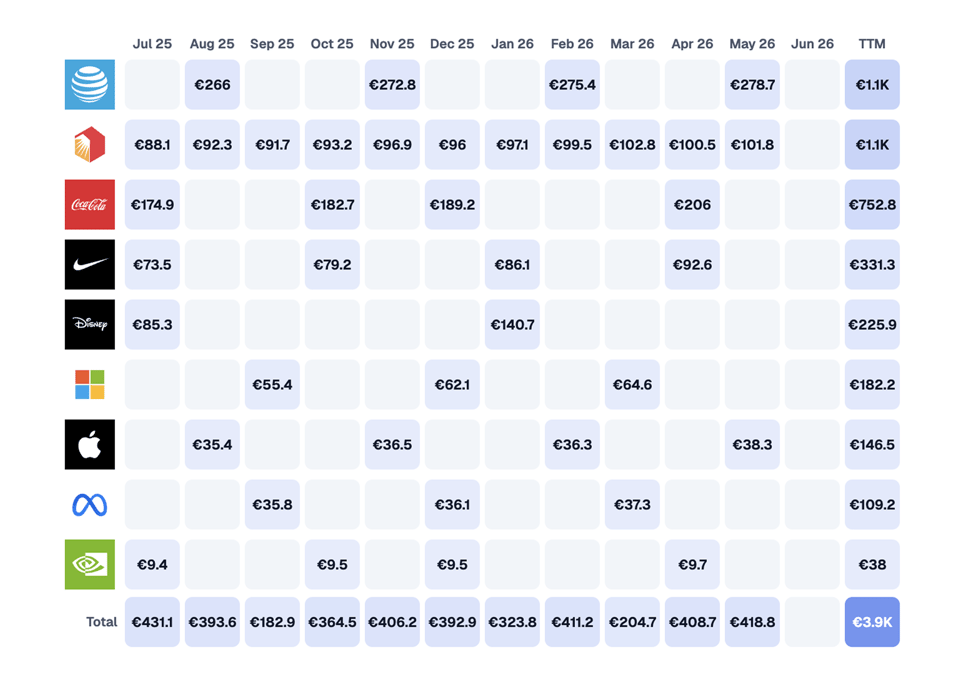
Track your upcoming dividends so that you can plan which holdings to keep and which to sell.
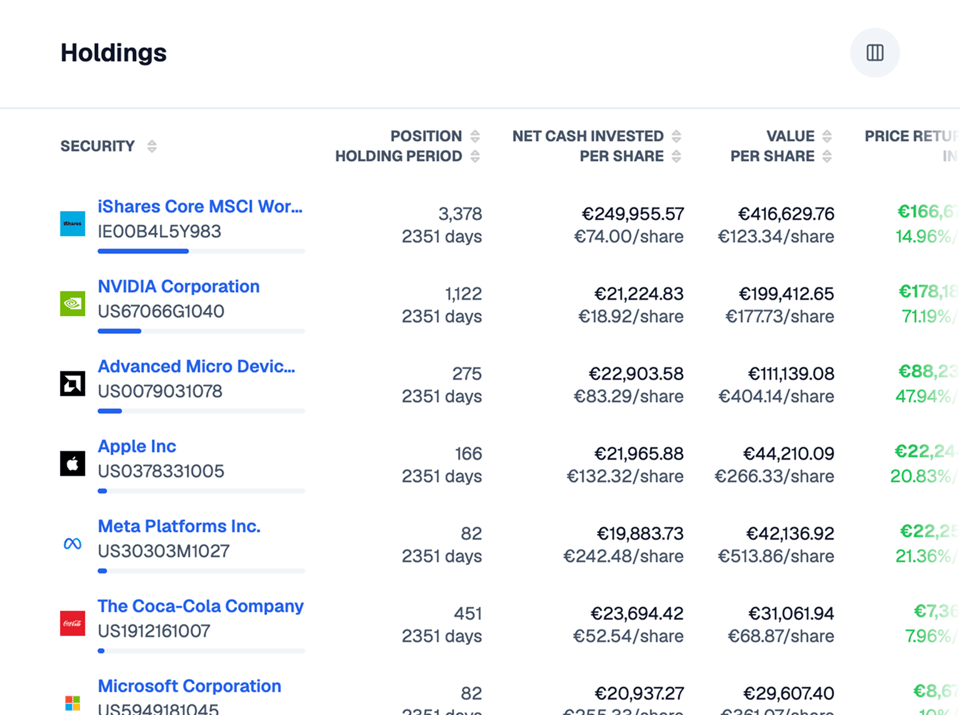
Get a perfect overview of all your investments in one place. Easily see your asset allocation and how well each asset performs. For each holding, we show you its absolute and annualized net return including fees and dividends.
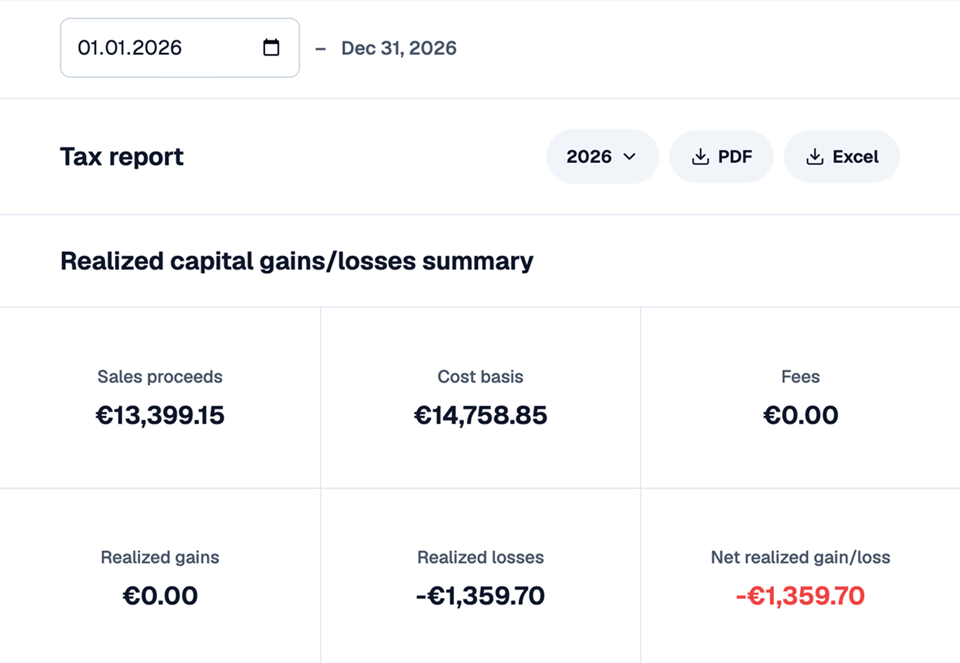
Doing your taxes used to be a hassle. Not anymore. With our detailed tax report, you have everything you need to file your taxes. See a sample tax report.
You don't have to enter your trades manually. Just drag & drop your account statements from your broker or spreadsheets. We do the rest.
Don't take our word for it. See what our customers have to say.
Your site is beautiful.
Really nice app, looks nice and its not that hard to use
I really like your service cos Degiro's tracking is kind of bad.
It allows me to stay on top of my investment portfolio, enabling to make informed investment decisions.
An easy app to track your portfolio of stocks.
It's easy to use, easy to import transactions and I can quickly see my portfolio's stats. I haven't found any other web app that does what this web app does as well.
Love the tool. Degiro is a total pain when it comes to portfolio tracking. Your service is awesome.
A fresh and reliable app to track accurately your portfolio status, gains and keep track of your taxes. It helps me evaluate my investing choices.
Some of the offered functionalities are well above competitors in terms of price/quality and are very unique since they are focused on European investors who are under served in the market.
It shows me graphs DEGIRO does not so I get a different point of view on my portfolio.
Simple but effective...
After going through so many tracking platforms and applications I really struggled to find anything I liked that served my needs. I used to track every transaction, deposit, withdrawal and fee as well as map my progress in my own spreadsheets. Tracking myself became unmanageable as my portfolio grew, so it was time for me to give it the quality it deserved. I then found Simple Portfolio and really liked it. I became a paying customer really quickly, which is unusual for me.
What I really like now about this product is not only the ease and compatibility with difficult brokers like DEGIRO, but also how its constantly being improved. There is a really good developer behind the project and the support is second to none. I am genuinely excited to see the product evolve.
I have used the product for almost 6 months now and buzz off keeping my portfolio up to date in order to track my performance each month. Worth a look if you manage any financial portfolio and need to track its performance.
$0 /month
or $0 /year
$9 /month
or $90 /year 2 months for free
Ask us at [email protected] or via the chat.